Research question
Exp1: how does acceleration of an object depend on the net force acting on it?
Exp2: how does acceleration of an object depend on the mass of it?
Exp2: how does acceleration of an object depend on the mass of it?
Variables
Exp1:
control: total mass, same cart, same track (surface material)
independent: net force
dependent: acceleration
Exp2:
control: net force
independent: mass
dependent: acceleration
control: total mass, same cart, same track (surface material)
independent: net force
dependent: acceleration
Exp2:
control: net force
independent: mass
dependent: acceleration
Methods for effective control of variables
- use the same set of cart, track, hanger, and masses to make sure anything related to the materials do not influence the result
- for exp1, all of the mass go on the cart or the hanger, so the total mass is always the same
- for exp2, the mass on the hanger will stay the same so the net force is always the same
Method for data collection
- A motion sensor will be used to detect any change in velocity, and the slope of v/t graphs can be used to compare acceleration
- this allows a one-time collection for each test that is both very precise, accurate, and collects a wide range of points
Procedure
Exp1:
- put some mass on the hanger, put the rest on the cart
- record total mass (kg) on the hanger (change in net force (N))
- push the cart to the end of the track
- start motion sensor and release cart
- stop cart before the hanger hits the ground and stop motion sensing
- measure acceleration using logger pro:
- select the interval where the v/t graph shows a slanted slope (the cart is in motion)
- choose 'linear fit', find and record the slope, which is the acceleration (m/s^2)
- put another measure of mass on the hanger and repeat #1-4
- record all accelerations and put them into a new graph as the y variables in relation to net force
- put no mass on the hanger (so its 50g by itself) and put some mass on the cart
- record total mass (kg) on the cart (change in mass)
- push the cart to the end of the track
- start motion sensor and release cart
- stop cart before the hanger hits the ground and stop motion sensing
- measure acceleration using logger pro:
- select the interval where the v/t graph shows a slanted slope (the cart is in motion)
- choose 'linear fit', find and record the slope, which is the acceleration (m/s^2)
- put another measure of mass on the cart and repeat #1-4
- record all accelerations and put them into a new graph as the y variables in relation to total mass
Labeled diagram
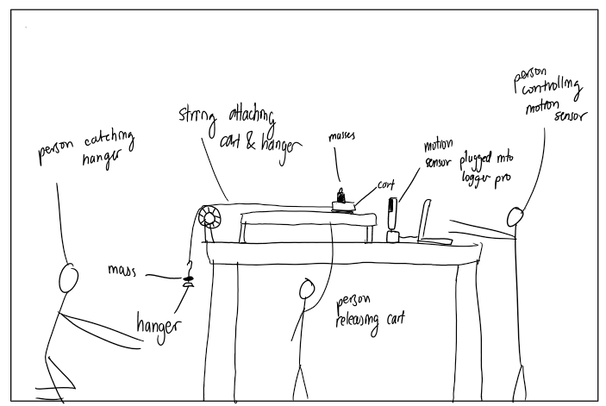
*both experiments have the same setup. The only difference is that exp1 has mass on the hanger and exp2 doesn't.
Recorded and Processed Raw Data
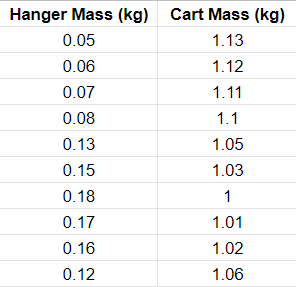
(above) recorded mass on cart and hanger including them for exp1
control: total mass= 1.18kg
control: total mass= 1.18kg
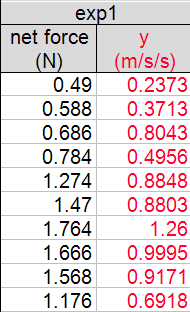
(above) processed net force and acceleration
net force (sigma F in newtons)=hanger mass*9.8 (gravitational acceleration)
acceleration= linear fit's slope in logger pro
net force (sigma F in newtons)=hanger mass*9.8 (gravitational acceleration)
acceleration= linear fit's slope in logger pro
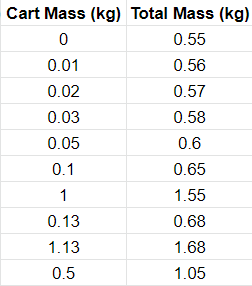
(above) recorded mass on cart (cart weights 0.5kg) and total mass of exp2
control: hanger mass= 0.05kg
control: hanger mass= 0.05kg
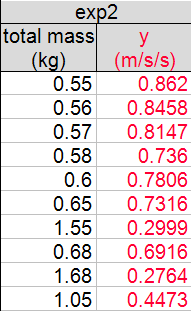
(above) processed acceleration
net force is also processed but since it stays the same (0.05*9.8=0.49N), it is not presented in logger pro settings as above
net force is also processed but since it stays the same (0.05*9.8=0.49N), it is not presented in logger pro settings as above
Presentation of processed data
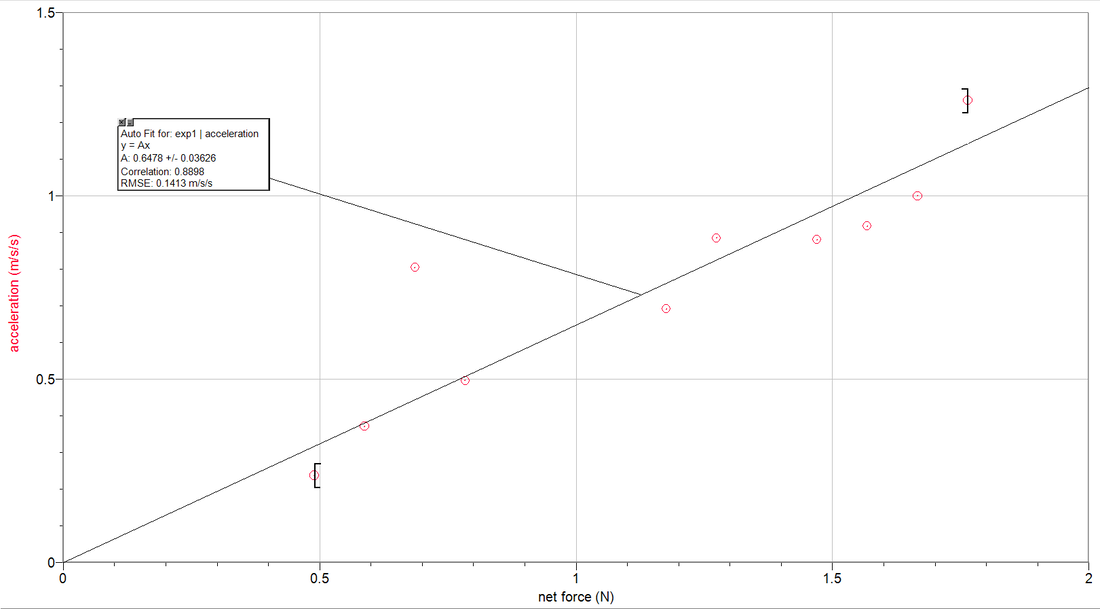
(above) exp1 graphical analysis
- a = 0.6478N
- slope=0.6478= for every 1N increase in net force, there will be a 0.6478m/s^2 increase in acceleration of the hanger
- y int= when you have no mass, you have no acceleration
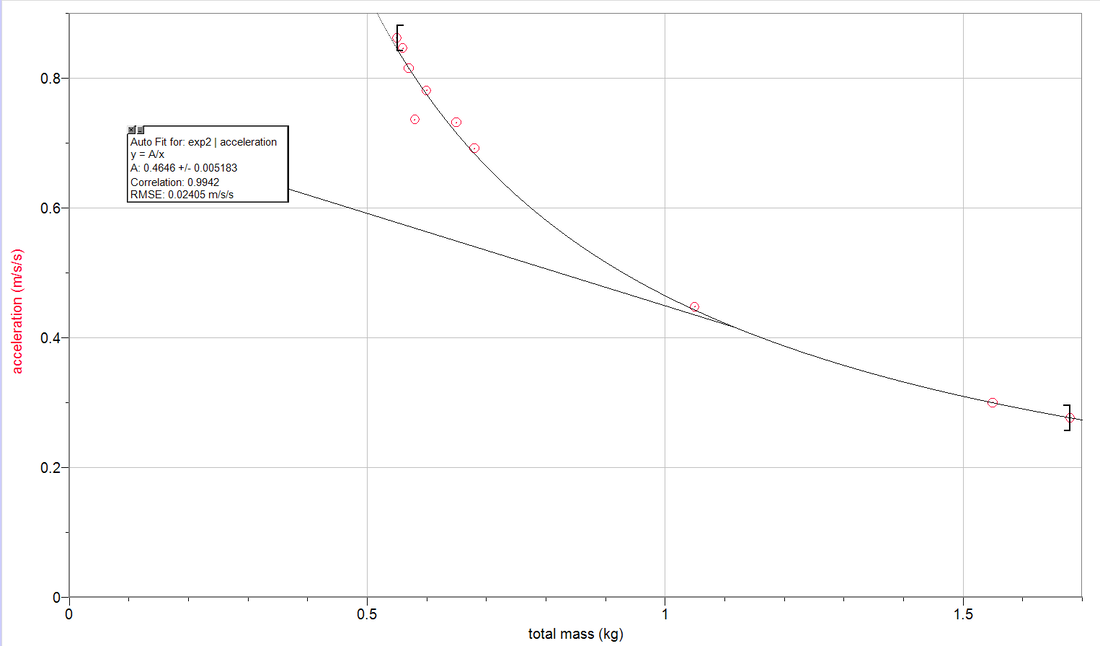
(above) exp2 graphical analysis
- a = 0.4646/M
- slope=0.4646/X = for every 1kg increase in total mass, the acceleration will be 0.4646/x+1
- y int= N/A
Conclusion
2 experiments were designed to test the effect of mass and net force on acceleration.
For exp1, the graph has a positive linear association, meaning that the more net force we have, or the more weight we have on the hanger, the more acceleration it receives. This makes sense because according to Newton's second law of motion, net force = m*a. When acceleration is constant, a bigger mass will result in a bigger net force. According to newton's first law of motion, an unbalanced force will result in acceleration, so a bigger net force increases acceleration. Thus we can conclude and generalize that the more net force, the bigger acceleration.
For exp2, the graph has a negative curved association, meaning that the more mass on the cart, the slower acceleration there is. Our group chose an inverse fit instead of a quadratic fit for better extrapolation and predictions because the graph should not curve back up like in a quadratic model. When mass increases, there is more inertia, thus the cart's resist to motion increases and acceleration decreases. We can conclude and generalize that the more mass, the bigger inertia, the smaller acceleration.
Evaluating procedures
- weaknesses and limitations: the experiment setup meant that it can only be used to test small quantities of mass. When it gets too heavy, either the hanger will drop too fast to catch/rope will break/cart will go too fast and fly off the track. With a motion sensor, most other weaknesses and limitations are avoided.
Improving the investigation
- if there is enough time, collecting more data points over a wider range can make the graph more accurate
- to reduce errors, only select a tiny interval that is far from the boundaries of velocity slope change to avoid taking in unnecessary data that might influence the linear fit that checks for acceleration
