Research question
How does time affect the position of a cart on a ramp?
Variables
Control (when multiple trials): same cart, same slope of ramp, same surface material
Independent: time (sec)
Dependent: position (cm)
Independent: time (sec)
Dependent: position (cm)
Control methods
- Only one video is recorded for this lab, so no controls are needed
- If multiple trials are needed, use the same cart and same ramp in locked position to make sure nothing changes on the slope and cart
Data collection methods |
- Taking a video including a measurement reference will be sufficient for a large range and a lot of data points
- Time interval is 1/30 s as that is the frame rate of phone video recordings
- data points collection from imported video in Logger Pro 3.15
- set origin and scale according to a visible point on the cart and the meter stick, respectively
- sync video to graph on the frame where first movement of cart down the ramp is detected
- plot down points according to each frame increase of video until the point on the cart reaches the end of the ramp
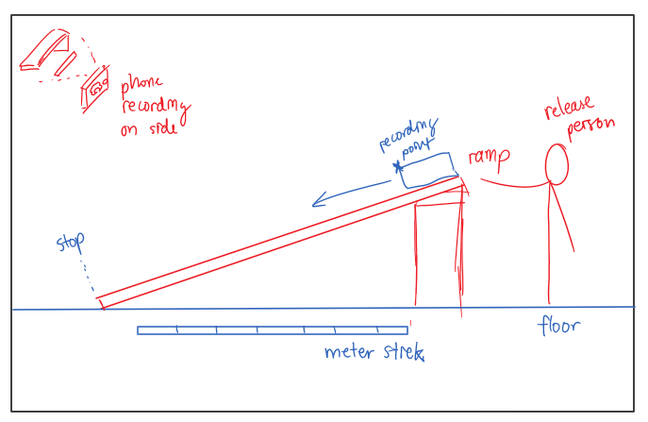
Procedure
- Put down a meter stick as distance reference tool beside the ramp (previously set by instructor)
- Place phone on stable surface far away enough to take in the entire ramp and the meter stick without distortions
- Start recording on phone
- Release cart from top of the ramp and let it go until the head touches the end of the ramp
- cart stopper stops the cart and recorder ends recording
- Import video into Logger Pro 3.15 and do video analysis according to methods described above
Lab setup
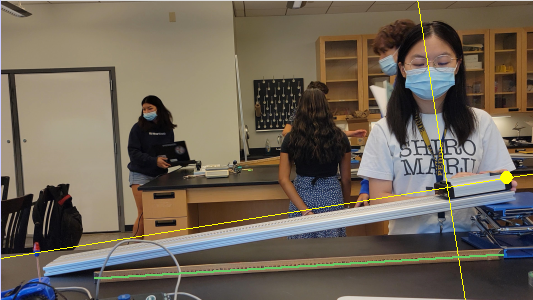
origin = the intersection point of the two yellow lines in the video snapshot
Recorded raw data
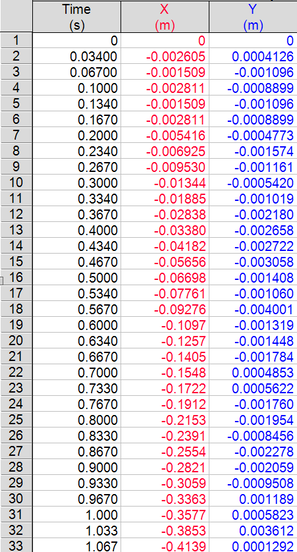
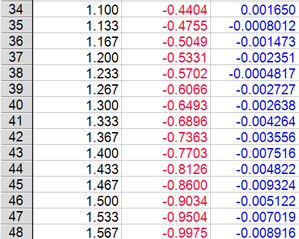
(above) X = distance from origin, assuming every click is on the same point of the cart
Processed raw data
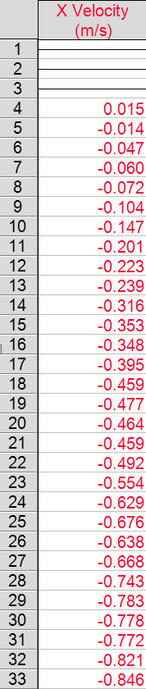
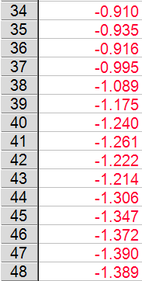
(above) Y measurements are not used for this lab, so it is deleted from the processed data set.
X velocity calculated by logger pro assuming every point clicked on the video does roughly hit the same point on the cart for every frame. The data for the first three points are deleted
X velocity calculated by logger pro assuming every point clicked on the video does roughly hit the same point on the cart for every frame. The data for the first three points are deleted
Presentation of processed data
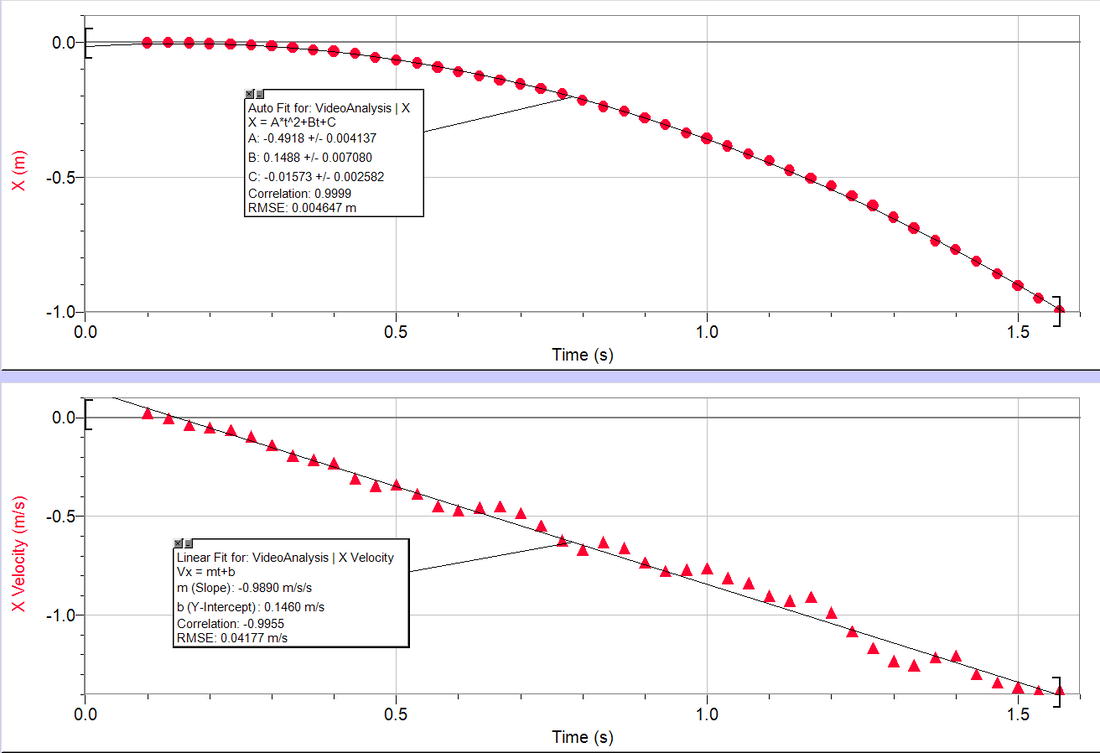
Position time graph analysis:
- X= -0.4918t^2-0.1488t-0.01573
- slope = as time increases, the position of the cart decreases (distance increases in the opposite direction)
- y intercept = -0.01573- this is the origin, it should be 0 but the best fit model slightly adjusts it
- V= -0.9890t+0.1460
- slope = -0.9890- for every 1s increase, the cart accelerates at constant of -0.9890cm/s^2.
- y intercept = initial velocity of the cart is -0.1115. It should be a positive number if video analysis started on the second the cart starting moving out.
Conclusion
The data shows that as time increases, the change in position increases because the cart is accelerating on the ramp. The steepness of the p/t graph is changing, showing a decreasing velocity. In comparison, the v/t graph shows a linear relationship, which means that the slope, or acceleration in this case, is constant. Since the signs of the p/t graph and v/t graph slopes are both negative, we can conclude that the cart is accelerating to the west.
A generalization made from this lab is that when the signs of the slopes of a p/t graph and v/t graph are the same, then the object is accelerating: if both are positive, the object is accelerating; if both are negative, the object is accelerating in the opposite direction.
A generalization made from this lab is that when the signs of the slopes of a p/t graph and v/t graph are the same, then the object is accelerating: if both are positive, the object is accelerating; if both are negative, the object is accelerating in the opposite direction.
Evaluating procedures
- Weaknesses, limitations and uncertainties- points are plotted on the video through eyeing a fixed part of the cart. This can be less accurate as the human eye is not as sharp as computer capturing, however this is not a major weakness.
Improving the investigation
- alternative methods for more accurate results may include using a motion sensor instead of a phone and eye capture to detect the cart's movement. It will be much more accurate and possibly more precise.
