Research question
How does time affect the position of a cart on a ramp?
Variables
Independent: time (sec)
Dependent: position (m)
Controls: same cart, same ramp, same slope and surface material
Dependent: position (m)
Controls: same cart, same ramp, same slope and surface material
Variable controlling methods
- When multiple tests are involved, using the same cart and same ramp (in locked position) will make sure anything involving the physical properties of the cart, the ramp, the slope and surface material remain the same
- Since we only need to do the test once, not much controlling methods are needed
Data collection method
- taking a video and do video frame analysis will ensure a large range and quantity of data points
Procedure
- Set down meter stick and prepare phone on a stable surface so it can record the entire ramp + meter stick
- Start recording and release cart from the top of the ramp
- When the head of the cart passes the end of the ramp, stop the cart and stop recording
- Import video into Logger Pro 3.15 and start video analysis
- set origin and sync film to graph on the first frame where the cart was released and has motion
- set scale by measuring the meter stick as reference (stick = 1m)
- rotate xy plane to make sure the x axis aligns with the path the cart is going down on
- insert data point on the same visible part of the cart for every frame; points will be automatically arranged into a table
- create a position/time graph and velocity/time graph based on data set
Labeled Diagram
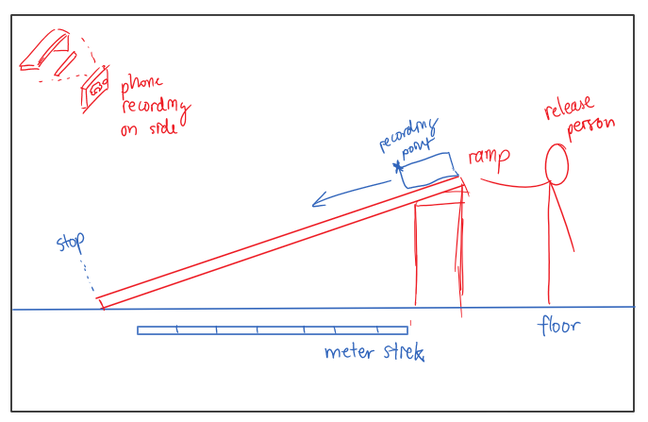
(below) the intersection point of the two yellow lines is the origin

Recorded Raw Data
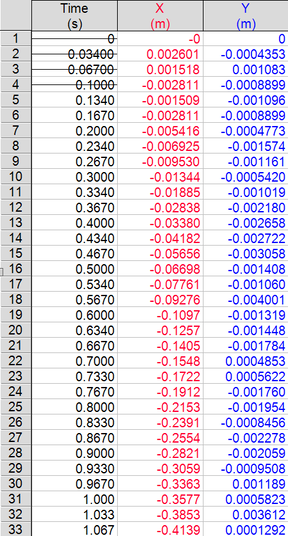

Uncertainties: all value are eye captured so slight differences from the real value may occur
Unmeasured controls: mass of cart, slope angle of ramp
Unmeasured controls: mass of cart, slope angle of ramp
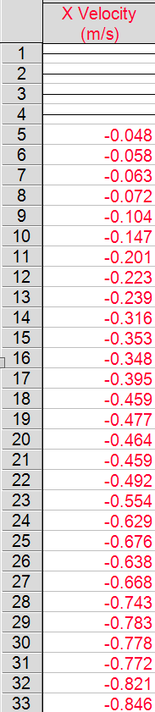
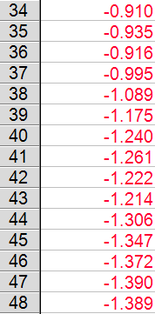
Processed raw data
|
- The Y value is not needed in this lab, therefore is not processed for forward graphing
- The X values are processed for velocity by logger pro
- The first four points are not considered for processing because they are points before the cart actually started moving down the cart, and may affect conclusions
Presentation of Processed Data
Graphical analysis
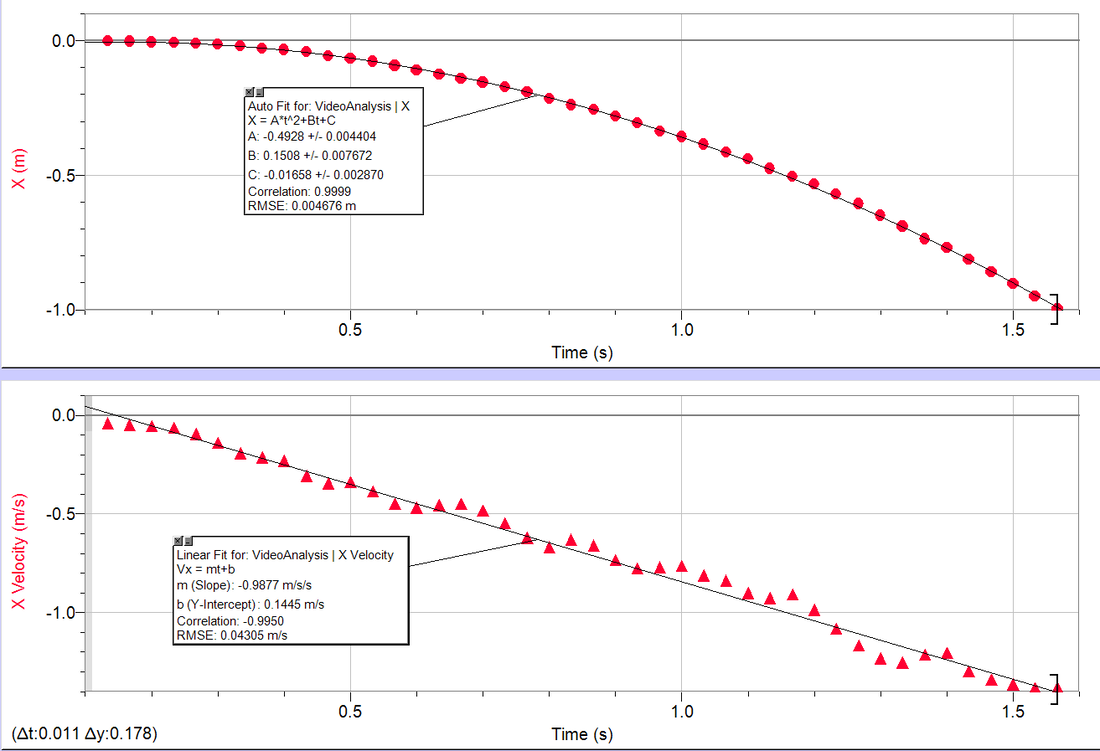
Position/time graph:
- x = -0.4928t^2 + 0.1508t -0.01658
- slope = as time increases, the cart's position decreases (the distances increases though)
- y intercept = it should be zero, marking the origin, but due to the best fit model it is slightly off
- v = -0.9877t + 0.1445
- slope = the change in velocity equals the acceleration. For every 1s increase in time, the velocity changes by -0.9877m/s^2.
- y intercept = the initial velocity of cart. It would make more sense if the y int is negative because we didn't start capturing motion before the car moves, and the car is always moving in a negative direction
Conclusion
From the graph we can conclude that as time increases, the change in position increases too because the cart is accelerating.
The p/t graph tells us that the cart is moving away from the origin because the vertical difference is getting bigger. The negative sign shows that it is moving in the opposite direction, or to the west. The slope gets steeper, indicating a changing velocity. The v/t graph tells us that the velocity is indeed decreasing. The linear fit shows that it has a constant, negative acceleration, as the sign is negative. Common sense and just by viewing the video tells us that the cart is accelerating as it goes down the ramp, even though the acceleration is negative. Thus, we can see that if both signs are negative, despite it seems counter-intuitive, the cart is accelerating.
We can make the generalization that if the signs for slope of the p/t graph and the v/t graph are the same, then the object is accelerating. The only difference is that positive signs means that the object is going forward from the origin and negative signs mean the object is boing in the opposite direction. Also, we learned that acceleration is the change in velocity divided by time, according to the v/t graph.
Evaluating Procedures
Weaknesses, limitations and uncertainties: as previously said, the entire point plotting process is based on human eye capturing a visible part of the cart moving as frames increase through the video. The eye may not be accurate enough, however errors are limited to at most several centimeters.
Improving the Investigation
One alternative method to reduce errors and improve accuracy and precision is to use a motion sensor instead of a phone. A motion sensor is much more sensitive than a human eye and can give really accurate points while also automatically generating a graph for the data set.
